| < Previous page | Print version | Next page > |
Managing your model - Project Explorer
This chapter shows you how to manage your DEA project
The Project Explorer can be hidden or brought to view using the icon
 . It has two top-level menus, Data and Models with a number of sub-menus each as illustrated below. . It has two top-level menus, Data and Models with a number of sub-menus each as illustrated below.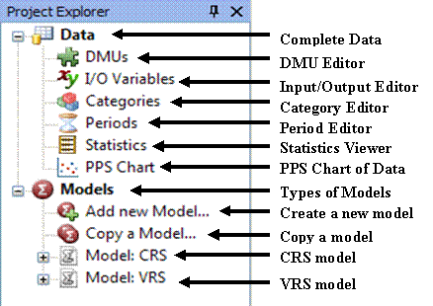
The icon;
 will only be on show when you hold your mouse over the 'Project Explorer' icon on the far left of the screen. will only be on show when you hold your mouse over the 'Project Explorer' icon on the far left of the screen.
The icon;
 next to next to  removes the project explorer completely. It can then only be retrieved, through the toolbar by clicking on 'view' and then 'solution explorer'. removes the project explorer completely. It can then only be retrieved, through the toolbar by clicking on 'view' and then 'solution explorer'.
DATA MENU
This menu allows you to view and edit you complete data set. The sub-menus are:
DMUs
This allows you to rename your units and make a description of each if you wish. You can also add or delete units.
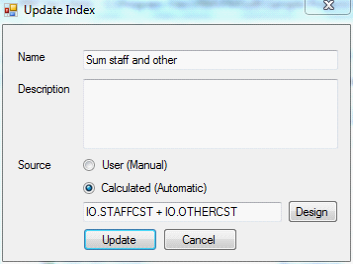
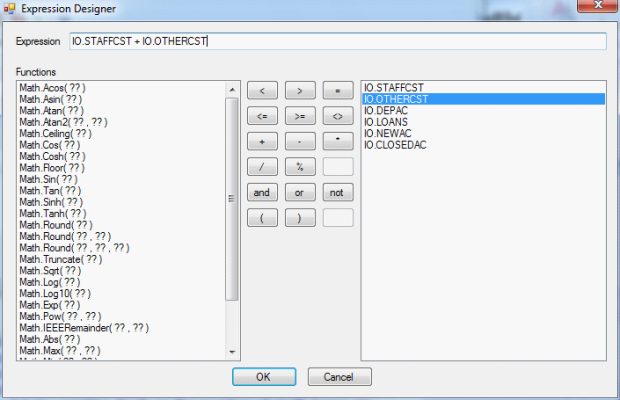
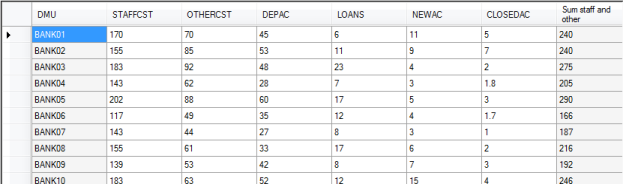
I /O Variables
This tool allows you to rename your inputs and outputs, describe them or ‘calculate’ them. For example if a model of assessing bank branches the user has specified separately the inputs ‘staffcst’ and ‘othercst’ and then wishes to run a model in which these two variables are added into an overall cost the user can proceed as follows. Click I/O variables and then ‘Add New’ and give a name to the new variable, e.g. ‘sum staff and other’. Under ‘source’ check ‘calculated (automatic)’ and enter the mathematical expression needed (e.g. ‘staffcst+othercst’ as illustrated below. You can also delete variables.
Categories
Your data could fall into a number of different categories, e.g. location or size of a bank branch. This allows you to rename your categorical variable and make a description of each if you wish. You can also add or delete categorical variables.
Periods
This tool is similar to the category editor above but in relation to time periods.
Statistics
This is a very useful tool computing summary statistics of your data including: mean, standard deviation, variance, minimum, maximum and range. These statistics are useful when trying to get a sense of your data.
PPS Chart
This is a very useful tool allowing you to quickly view your data graphically, the efficient boundary and the location of DMUs within the boundary. The next Chapter explains the production and control of the PPS.
MODELS MENU
If you double click ‘Models’ shortcuts appear enabling you to create some of the basic models (CRS and VRS) with or without the specification to compute Malmquist Indices at the click of the appropriate model tab.
Add a New Model
This tool allows you to add a new model name and proceed to specify it.
Copy a Model
This tool allows you to copy an existing model and perhaps proceed to modify it.
|